greyhound racing fan guides explain how race predictions have become a vital tool for casual fans and serious punters seeking a strategic edge. By combining a deep understanding of canine athleticism, track nuances, and statistical trends, you can craft forecasts that are both accurate and profitable. This greyhound race betting guide walks you through the essential elements of analysis, from reading form guides to interpreting trap draws, and shows how to build a reliable prediction system that works across the UK, Ireland, and Australia’s premier circuits.
Understanding the Basics of Greyhound Racing Predictions
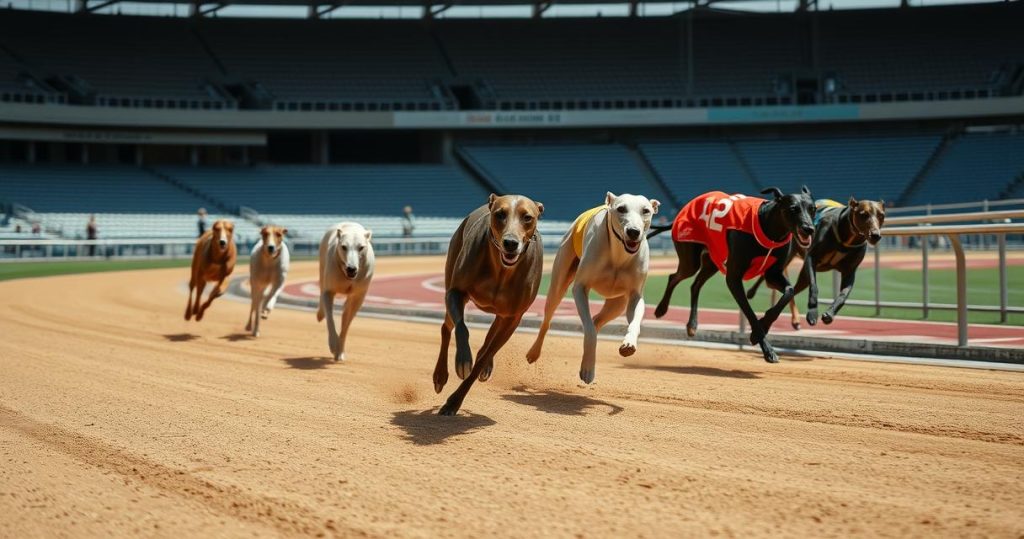
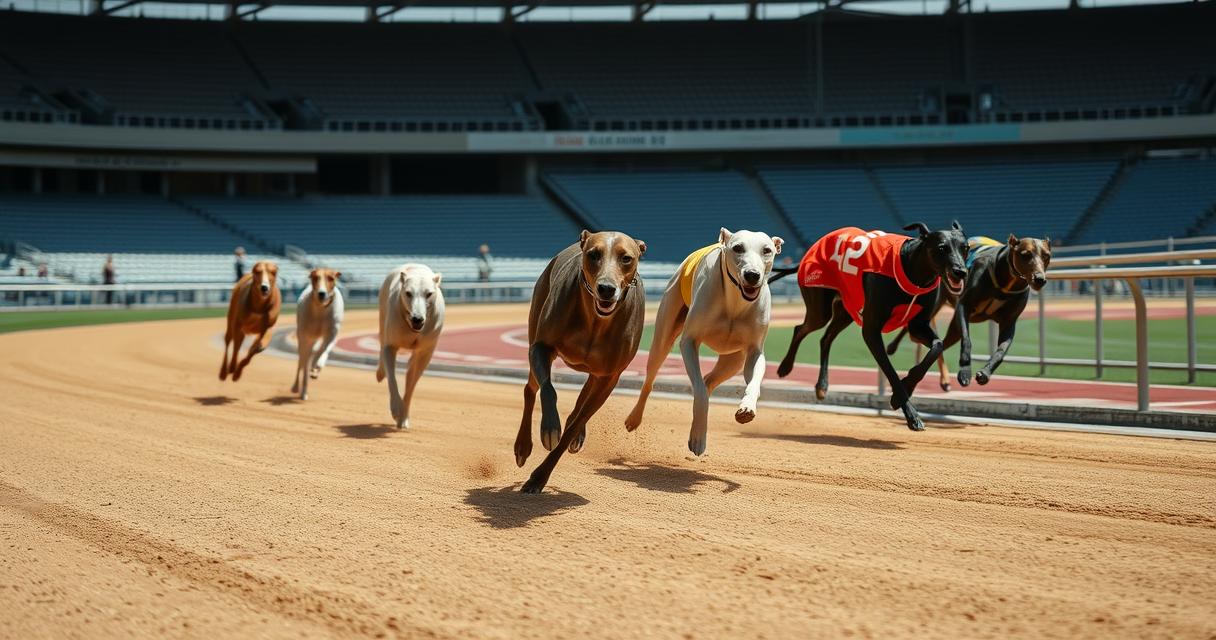
At its core, a greyhound race prediction is an educated estimate of which dogs are most likely to finish in the top positions of a given race. greyhound racing strategies focus on short sprint‑type distances—typically 480 m in the UK and 500–550 m in Australia—emphasizing early speed, break efficiency, and maintaining momentum through the bends. Successful predictions therefore require a blend of form analysis, knowledge of track characteristics, and an awareness of how each dog’s physical traits align with the race conditions.
Professional tipsters often start by reviewing the official race card, which lists each dog’s recent runs, trap number, trainer, and declared weight. These details form the foundation of any prediction, but they must be contextualised against broader patterns such as a dog’s performance on specific surfaces, its reaction to different weather, and how it has handled similar trap draws in the past. By treating each element as a piece of a larger puzzle, you can avoid the common pitfall of focusing on a single statistic and instead develop a holistic view of the race.
Analyzing Form and Recent Performance
The form guide is the most visible piece of data on a race card, but interpreting it correctly is where many predictions succeed or fail. Look beyond the simple win‑place‑show columns and examine the margins of victory or defeat, the type of race (e.g., open, graded, or handicap), and the distance of each previous run. A dog that consistently finishes within a length of the winner over 480 metres, even if it hasn’t secured a win, may be a strong contender when the conditions align.
Equally important is the time rating, often expressed as a “fast time” or “track record” for a given distance. Dogs that have posted times close to the track’s benchmark are demonstrating the raw speed needed for sprint races. However, be wary of outliers: a single fast time on a particularly firm track may not translate to a softer surface. Cross‑referencing the dog’s recent performances with the type of track surface it raced on provides a clearer picture of its true capability.
The Impact of Track Conditions and Weather
greyhound track conditions vary dramatically in surface composition—from deep sand at the UK’s Wimbledon Stadium to a looser, more granular mix at Australian venues like Wentworth Park. Weather adds another layer of complexity: rain can soften the surface, making it slower and favouring dogs with strong early acceleration, while dry, hot conditions often produce a faster track that benefits dogs with higher top‑end speed. When making predictions, always check the forecast and any recent track reports that note changes in footing or maintenance.
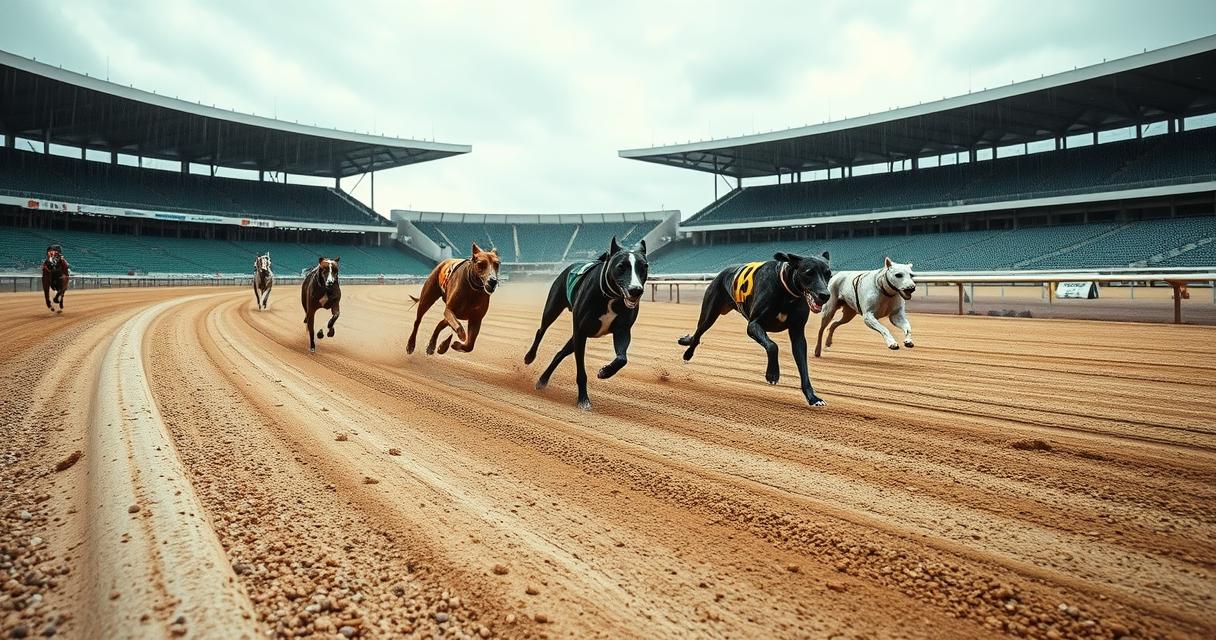
Seasonal trends also influence performance. For example, many trainers in the UK observe that dogs tend to peak in the autumn months when the weather is cooler and the track surface is less likely to become overly compacted. In contrast, Australian greyhounds often excel in the summer when the warmer climate produces a firmer surface. Incorporating these seasonal patterns into your prediction model can give you a statistical edge, especially when the competition is focusing solely on raw form.
Studying Trap Draws and Starting Positions
The trap draw is one of the most debated factors in greyhound racing, and for good reason. Dogs assigned to inside traps (1 or 2) typically have a shorter distance to the first bend, which can be advantageous if they break quickly. Conversely, outside traps (5 or 6) may benefit dogs that prefer to run wide, avoiding traffic on the inside rail. Understanding each dog’s preferred running style—whether it’s a “rail runner” or a “wide runner”—is essential when evaluating trap draws.
Historical data shows that certain traps produce higher win percentages at specific venues. For instance, at the UK’s Crayford Stadium, trap 4 has historically yielded a higher number of winners due to the oval shape of the track and the placement of the inside rail. By analysing trap statistics over a rolling 12‑month period, you can identify patterns that might not be obvious from the form alone. Combining trap analysis with a dog’s break reaction—often recorded in race replays—creates a more nuanced prediction.
Using Statistics and Advanced Metrics
greyhound racing statistics include advanced metrics such as “speed index,” “sectional times,” and “break percentage,” offering deeper insight into a greyhound’s performance beyond basic form and trap information. Speed index scores, which compare a dog’s time to the track’s standard, help normalise performances across different meetings and weather conditions. Sectional times break the race into specific segments (e.g., first 200 metres, final 200 metres), highlighting whether a dog excels in the early sprint or finishes strongly.
Break percentage, the rate at which a dog gets out of the traps cleanly, is particularly valuable for short‑distance races where the first 100 metres can decide the outcome. A high break percentage combined with a strong speed index often correlates with a higher probability of winning. Using spreadsheet tools or specialised racing software, you can track these metrics over multiple races, apply weighting factors, and generate a predictive score for each dog entering the race.
Incorporating Betting Markets and Odds
While statistical analysis forms the backbone of any prediction, the betting market itself offers useful information. Odds reflect the collective wisdom of the betting public and bookmakers, who adjust prices based on the amount of money placed on each dog. Sharp movements in odds—especially before the race—can indicate insider knowledge or late-breaking information such as a change in the dog’s training regime or a sudden track alteration.

Smart punters often compare their own predictive scores against the market odds to identify value bets. If your analysis suggests a dog has a 30% chance of winning (equivalent to roughly 3.33/1 odds) but the bookmaker offers 5/1, that discrepancy represents a potential betting edge. However, it’s crucial to monitor the liquidity of the market; low‑volume races may produce misleading odds, while high‑profile events like the English Greyhound Derby typically provide more reliable pricing.
Building a Personal Prediction System and Staying Updated
To consistently generate accurate greyhound race predictions, develop a personal system that blends the elements discussed above. Start by creating a template that captures each dog’s form, speed index, break percentage, trap draw, and track condition notes. Assign weighted scores to each factor based on your own observations and the historical data you’ve collected. Regularly back‑test your system against past race results to refine the weights and improve predictive accuracy.
Staying current is equally important. Subscribe to reputable greyhound racing newsletters, follow official track updates, and watch race replays to observe subtle changes in a dog’s running style. greyhound racing betting trends are often discussed in online forums and communities, where insider tips and emerging patterns are shared. By continuously updating your database and adjusting your model, you’ll maintain a competitive edge that adapts to the evolving dynamics of the sport.

Growing up near the local track, I developed a lifelong fascination with the athleticism and strategy behind greyhound racing. I spend my free time analyzing past performances and studying breeding lines to better understand the nuances of every race. Sharing insights and celebrating the incredible speed of these dogs is what keeps me passionate about the sport.