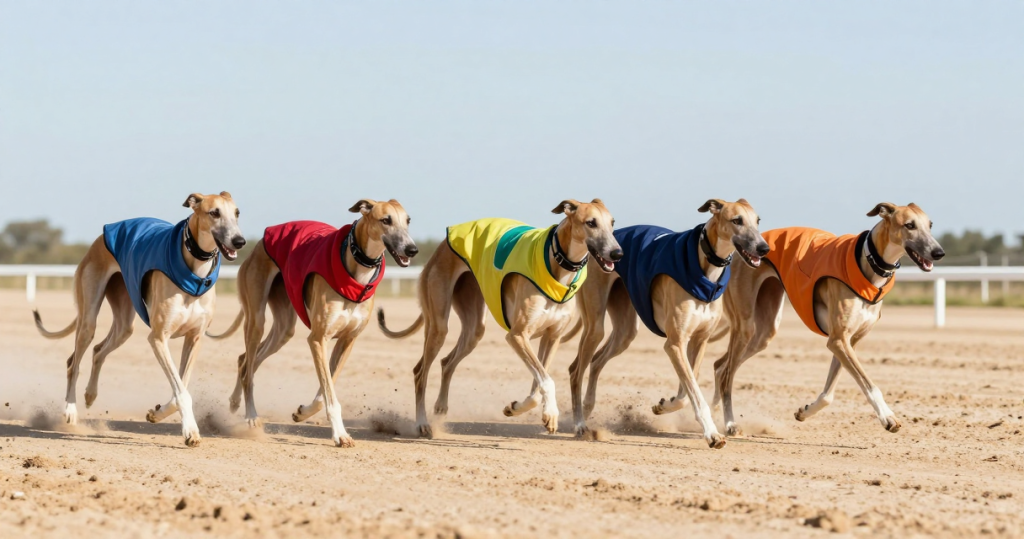
Greyhound racing may seem like a fast‑moving blur, but the numbers that follow each meeting hold the key to understanding form, spotting value, and making informed wagers. From the finishing order and split times to trainer details and betting forecasts, race results are a compact report card of every dog’s performance on the day. Whether you’re a seasoned punter, a casual fan, or a newcomer trying to decode the jargon, mastering how to read and use greyhound race results can dramatically improve your engagement with the sport and your chances of turning a profit.
What Goes Into a Greyhound Race Result?
At its core, a race result records the order in which the greyhounds cross the finish line, but the sheet is far richer than a simple list. The winning dog’s name is followed by its starting price (the odds offered by bookmakers), and the same information is presented for the runners‑up and the third‑placed finisher. In many result cards you’ll also find the name of the winning trainer, the exact off‑time (the moment the hare was launched), and the official race distance measured in lengths. Distances such as “1 ¼” or “2 ¾” convey how far each dog was behind the winner, expressed in fractions of a length, a standard unit in greyhound racing.
Additional fields often appear on the same sheet: the forecast, which indicates the total payout for a correct first‑second‑third forecast bet; the tricast, showing the payout for a correct first‑second‑third exacta; and the “off time” recorded in minutes and seconds, offering a quick reference for how fast the race was run overall. Together, these data points give bettors and analysts a snapshot of speed, consistency, and betting value in a single glance.
Understanding the Odds and Betting Terms
Odds are the most visible element of a race result, and they translate directly into potential profit. A starting price of 4/7, for example, means you must stake £7 to win £4, indicating a strong favourite. Conversely, odds of 12/1 suggest an outsider that could yield a sizable return if it places. The forecast and tricast values are calculated after the race based on the total pool of bets placed on a particular combination, so they can fluctuate dramatically from meeting to meeting. A high forecast, such as £38.30, signals that the market expected the top three finishers to be relatively close, whereas a low tricast payout may mean bettors correctly anticipated the order.
For those new to the sport, it’s crucial to distinguish between “win”, “place”, “forecast”, and “tricast” bets. A win bet only requires picking the first‑placed dog; a place bet pays out if the dog finishes within the predefined placings (usually first, second, and sometimes third). Forecast bets demand an exact order for the first two finishers, while tricast demands the exact order of the first three. Understanding how each of these payouts is derived from the result sheet helps you decide where to allocate your stake for maximum value.
Where to Find Reliable UK Greyhound Results
The United Kingdom hosts a robust network of tracks, each publishing daily results through dedicated platforms. Websites such as Sporting Life’s “Fast Results” provide up‑to‑the‑minute updates, displaying the winning trainer, off‑time, distances, and betting payouts for each meeting. For instance, a recent Nottingham meeting listed Skyfall Khan as the winner at 4/7 odds, with a finishing time of 20:46 and a distance of 1 ¼ behind the second‑placed dog. These sites often include a “forecast” column that indicates the total payout for a correct forecast bet, allowing punters to gauge how much the market expected the top finishers to be.

In addition to real‑time portals, the Timeform service aggregates results from all UK fixtures, offering a searchable database that can be filtered by date, venue, or dog name. This historical archive is invaluable for spotting patterns, such as a trainer’s win rate at a particular track or a dog’s performance over a series of races. By cross‑referencing the live results with the Timeform archive, bettors can confirm whether a dog’s recent form aligns with the odds offered, helping to identify potential value bets that the market may have undervalued.
Accessing Irish Greyhound Racing Results
Across the Irish Sea, the Irish Greyhound Board (now Greyhound Racing Ireland) maintains an extensive results portal that mirrors the depth of UK data. Users can select a specific stadium—from Shelbourne Park in Dublin to Curraheen Park in Cork—and view detailed outcomes for each meeting. The results page typically lists the winner, runner‑up, and third‑placed dogs, along with their respective starting prices, trainer names, and finishing times. For example, a recent meeting at Clonmel might show a 12/1 winner with an off‑time of 20:16, accompanied by distance markers that indicate how tightly contested the race was.
What sets the Irish system apart is its integration of video archives and a “Greyhound Search” tool, allowing enthusiasts to track a specific dog’s career across multiple venues. By entering a dog’s name, users can retrieve a chronological list of all its finishes, including the distances behind the winner and any notable improvements in time. This level of granularity supports a more sophisticated approach to form analysis, enabling bettors to spot long‑term trends that might not be evident from a single day’s results alone.
How to Use Race Results for Betting Strategy
Effective betting hinges on turning raw data into actionable insight. One practical method is to compare the official off‑time with the forecast odds. If a race’s forecast payout is unusually low relative to the winning odds, it may indicate that the market collectively overestimated the favourite’s chances, presenting a potential opportunity to back an underdog with better value. Conversely, a high forecast suggests the market expected a close finish, and a well‑timed place bet on a dog that finished just a length behind the winner could prove lucrative.
Another strategy involves tracking a trainer’s success rate at a particular track. Some trainers specialize in specific circuits, and their dogs often improve over successive runs at the same venue. By reviewing a series of results from a single stadium, you can calculate a trainer’s win percentage and identify “hidden gems”—dogs that consistently finish in the top three but may not attract the shortest odds. Pairing this analysis with the dog’s recent split times (when available) can reveal whether a greyhound is gaining speed as the race progresses, an indicator of stamina that is prized in longer distance events.
Analyzing Trends and Performance Metrics
Beyond individual race cards, the aggregation of results into larger datasets enables deeper statistical analysis. Key performance metrics include average winning time, mean distance between first and second place, and the frequency of “sh” (short head) finishes, which denote extremely close races. Monitoring these trends over weeks or months can highlight shifts in track conditions—for example, a series of faster times may suggest a drying track, while increasing distances could indicate a softer surface that slows the pack.
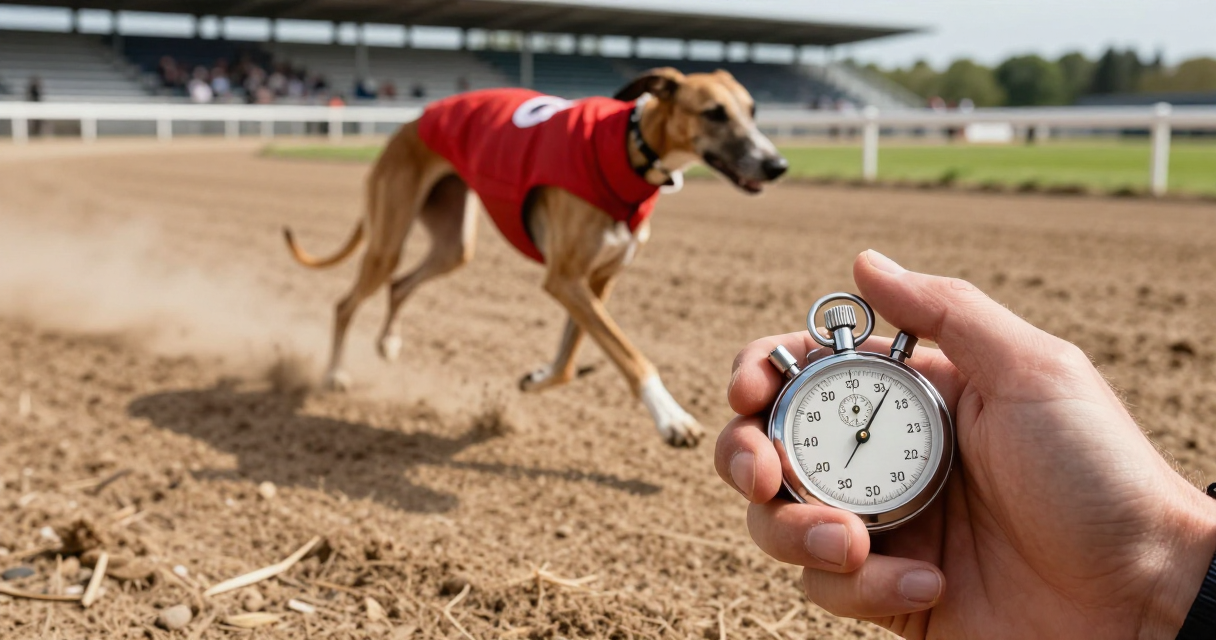
Advanced bettors also employ “form cycles” to assess whether a greyhound is on an upward trajectory. By plotting a dog’s finishing positions against its most recent races, you can detect patterns such as a three‑race winning streak or a series of narrow defeats. When combined with the trainer’s historical data and the dog’s age, these cycles help predict future performance more accurately than odds alone. Many modern betting platforms now provide built‑in tools for visualizing such data, but the underlying principle remains the same: a comprehensive understanding of results translates directly into better decision‑making.
The Future of Greyhound Race Results in a Digital Age
Technology is reshaping how race results are delivered and consumed. Live streaming, mobile apps, and instant‑push notifications now bring the official off‑time and finishing order to fans’ fingertips within seconds of the race’s conclusion. This immediacy not only enhances the spectator experience but also allows bettors to place in‑play wagers on subsequent races or on “multi‑race” bets that depend on early results. Integration with predictive algorithms—powered by machine learning models trained on years of historical data—offers another layer of insight, generating probability scores that can be compared against bookmaker odds for potential arbitrage opportunities.
Regulatory developments also influence the landscape of greyhound racing data. Recent legislative changes, such as the ban on greyhound racing in Scotland, have altered the geographic distribution of meetings and consequently the volume of available results. Meanwhile, the industry’s ongoing commitment to animal welfare has led to stricter reporting standards, ensuring that result sheets now often include additional welfare indicators like post‑race veterinary checks. As the sport continues to evolve, the depth and reliability of race results will remain a cornerstone for fans, trainers, and bettors alike, providing the factual foundation upon which the excitement of greyhound racing is built.

Growing up near the local track, I developed a lifelong fascination with the athleticism and strategy behind greyhound racing. I spend my free time analyzing past performances and studying breeding lines to better understand the nuances of every race. Sharing insights and celebrating the incredible speed of these dogs is what keeps me passionate about the sport.