Greyhound racing thrives on the fine line between raw speed and precise timing, and the statistics that capture this balance are the lifeblood of every trainer, owner, and bettor. In the United Kingdom and Ireland, official timing systems record each run to the thousandth of a second, allowing analysts to break down a dog’s performance into measurable components. Understanding how these numbers translate into real‑world success requires more than a glance at a single time; it demands a holistic view of speed, acceleration, class, and consistency. This article walks through the most important performance metrics, explains how they interrelate, and shows how savvy readers can turn raw data into actionable insight on the track.
Understanding the Core Metrics: Speed, Split Times, and Acceleration
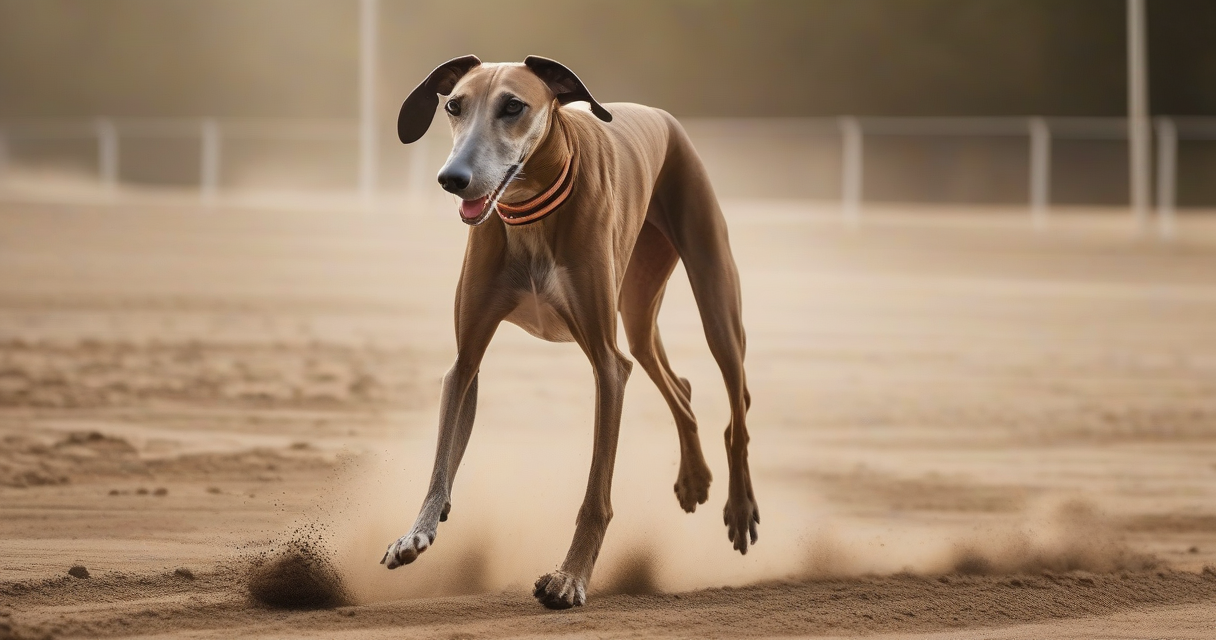
At the heart of any greyhound’s record lies its top speed, usually expressed in miles per hour or meters per second. The elite sprinters on the Irish circuit regularly break the 45 mph barrier, while a solid mid‑tier runner averages around 38 mph over the standard 480‑meter distance. Speed alone tells only part of the story; split times reveal how quickly a dog reaches its peak. A typical split for a high‑performing greyhound might be 5.2 seconds for the first 100 meters, followed by a steady 5.8 seconds for the next 100 meters, indicating a strong early burst and sustained momentum.
Acceleration, measured as the change in speed between successive splits, is a critical differentiator on tight bends and short sprints. Dogs that can increase their velocity by 0.3 m/s between the first and second split often gain a decisive edge over competitors who plateau early. Trainers use these figures to adjust warm‑up routines and to select optimal trap positions, aiming to maximize the dog’s natural acceleration curve. By tracking acceleration trends across multiple races, one can predict whether a greyhound is likely to improve, maintain, or decline in future outings.
The Role of Class and Grade in Performance Evaluation
Greyhounds compete in a hierarchy of classes, ranging from Class 5 for newcomers to Class 1 for the most seasoned athletes. Each class carries a minimum rating, typically expressed in a numeric value that reflects the dog’s historical speed and win percentage. A Class 1 greyhound might hold a rating of 115 or higher, while a Class 3 runner usually sits between 85 and 100. These ratings are not static; they adjust after every run based on the dog’s finishing time relative to the track’s standard. This dynamic system ensures that a dog’s class accurately mirrors its current form, providing a reliable benchmark for trainers and bettors alike.
Grade, a subcategory within each class, further refines the evaluation by grouping dogs with similar ratings together for a single race. For example, a Grade A race in Class 2 may feature dogs rated between 90 and 95, while a Grade B race might include those between 95 and 100. Understanding how a greyhound’s grade aligns with its class helps identify the level of competition it faces and predicts the likelihood of a win. A dog consistently winning Grade B races is often poised for promotion to Grade A, signaling an upward trajectory that can be capitalized on by savvy bettors.
Interpreting Form Guides: Recent Runs and Consistency
Form guides compile a greyhound’s last five to ten races, displaying finishing positions, times, and any incidents such as “bumped” or “blocked.” Consistency is gauged by the spread of these times; a narrow range suggests a reliable performer, while wide fluctuations may indicate vulnerability to track conditions or trap draws. For instance, a dog posting times of 28.70, 28.74, and 28.71 seconds over three consecutive races demonstrates a stable performance level, whereas another with times ranging from 28.30 to 29.10 seconds raises questions about its adaptability.
Beyond raw times, the form guide notes the trap number and the dog’s reaction at the start. A greyhound that consistently breaks well from trap 4, but struggles from trap 1, may be better suited to tracks where the preferred trap is central. Analyzing these patterns helps trainers adjust race strategies and enables bettors to identify value when a dog’s preferred trap aligns with the upcoming race’s draw. Over time, a clear pattern of strong starts and minimal interference can be a reliable predictor of future success.
How Track Conditions and Surface Types Influence Stats
Every racing venue presents unique variables, from sand composition to weather‑induced moisture levels. A dry, compacted sand surface typically yields faster times, allowing a greyhound to shave off a few hundredths of a second per 100 meters compared with a wet, loamy track. Seasonal changes also affect performance; a dog that excels on a firm summer surface may lose a tenth of a second on a softer winter track, altering its overall rating. Trainers keep detailed logs of each dog’s performance under varying conditions, using this data to select races where the surface aligns with the dog’s strengths.
Temperature and wind direction further complicate the picture. A warm day, with temperatures above 20 °C, can improve muscle elasticity, leading to marginally quicker acceleration. Conversely, a headwind of 5 km/h may add 0.2 seconds to a dog’s final time, a difference that can shift a race from a win to a place finish. By integrating weather forecasts with historical performance data, owners can make informed decisions about entering a greyhound in a particular meet, maximizing the chances of a favorable outcome.
Betting Odds vs. Statistical Reality: Spotting Value
Bookmakers translate a greyhound’s performance statistics into odds, but the market does not always reflect the underlying data accurately. A dog with a recent rating of 110 and a consistent split pattern may still be listed at 10/1 if public sentiment favors a more famous competitor. Identifying such discrepancies requires a side‑by‑side comparison of the dog’s actual times against the implied probability of the odds. For example, a 10/1 price suggests a 9 percent chance of winning; if the dog’s historical win rate from similar draws is 15 percent, the market is undervaluing the runner.
Advanced bettors often employ a “price‑to‑performance” ratio, dividing the odds by the dog’s average speed rating. A lower ratio indicates a potentially profitable wager. Additionally, examining the “each way” market, which pays out on place finishes, can reveal hidden value for dogs that consistently finish in the top three but rarely win outright. By cross‑referencing these financial metrics with the dog’s form, trap performance, and track suitability, bettors can construct a more nuanced betting strategy that goes beyond surface‑level odds.
Using Technology and Data Platforms for Real‑Time Analysis
Modern racing operations rely on sophisticated timing equipment and cloud‑based databases to capture and disseminate performance data instantly. Platforms such as the Greyhound Performance Index aggregate split times, acceleration curves, and rating adjustments for every registered dog, updating the figures within minutes of each race’s conclusion. This real‑time flow of information enables trainers to make rapid decisions about conditioning, race selection, and even equipment changes, such as adjusting a dog’s harness to improve aerodynamics.
Mobile applications now allow owners and bettors to overlay historical data onto live race feeds, visualizing a dog’s expected split pattern against the actual run as it unfolds. By observing deviations in real time, users can anticipate potential upsets or confirm a dog’s dominance before the finish line. Integration with GPS‑based tracking devices also offers a granular view of a greyhound’s stride length and frequency, data points that were previously inaccessible. As technology continues to evolve, the depth and precision of performance statistics will only increase, providing ever‑greater insight into the sport’s most fleeting moments.

Growing up near the local track, I developed a lifelong fascination with the athleticism and strategy behind greyhound racing. I spend my free time analyzing past performances and studying breeding lines to better understand the nuances of every race. Sharing insights and celebrating the incredible speed of these dogs is what keeps me passionate about the sport.